Why Your CPU Is Fast But Your Program Is Slow: Understanding the Memory Wall
My laptop's CPU can do billions of operations per second. I know this because the spec sheet told me, and I believed it, because I am a trusting person.
So when I wrote a program to scan a 1GB array and it took 400 milliseconds, I was confused. That's not billions of anything. That's just... slow. Embarrassingly slow. The kind of slow that makes you question your life choices.
The CPU wasn't the problem. It was sitting there, starving, waiting for data that memory couldn't deliver fast enough. This gap between how fast your CPU can work and how fast memory can feed it has a name: the Memory Wall. And once you see it, you can't unsee it.
So I built a small framework called Aletheia to understand this properly. I ran some experiments, expected boring gradual results, and instead got a performance cliff so sharp it looked like a bug. It was not a bug. It was the hardware telling me exactly how it works - I just had not been listening.
The Illusion of Compute
Here is something nobody tells you when you first learn programming: your CPU is almost never the reason your program is slow.
Modern processors are genuinely hard to wrap your head around. Your CPU is not sitting there executing one instruction, then the next, then the next, like a student working through a problem set. It is simultaneously predicting which instructions are coming several steps ahead, executing multiple instructions in parallel, and quietly reordering operations in the background to avoid sitting idle - all without you writing a single line to ask it to. This happens billions of times a second, every second, without you ever thinking about it.
A single integer addition on modern hardware takes roughly 1 nanosecond. In that same nanosecond, light travels about 30 centimeters. Your CPU is doing math at a speed that makes the laws of physics mildly uncomfortable.
So when your program is slow, the CPU has in all likelihood already done its part and is now waiting. The real question is not how to make your processor compute faster - it is why your processor is not getting the data it needs fast enough to keep up. That question is what the rest of this blog is trying to answer.
The Memory Wall
CPUs and DRAM have been improving since the 1980s, but they have not been improving at the same rate, and that difference has quietly become one of the biggest problems in systems performance.
Processors got dramatically faster over the decades - smaller transistors meant higher clock speeds, and smarter microarchitecture meant each clock cycle did more useful work. DRAM improved too, but mostly in terms of how much data it could store rather than how quickly it could hand that data over. The underlying physics of how DRAM is built puts a ceiling on how fast it can respond to a memory request, and that ceiling has not moved anywhere near as fast as CPU speeds have.
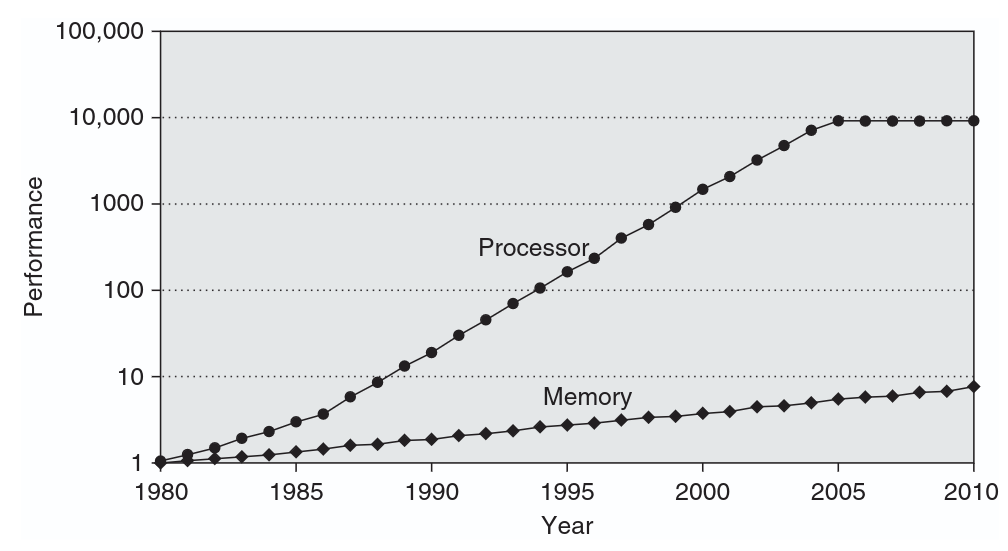
Figure: CPU performance vs DRAM performance over time.
Source: Computer Architecture: A Quantitative Approach, Hennessy & Patterson.
By the mid-90s, researchers were already writing about this and calling it the Memory Wall. The concern was not complicated - if the time it takes to fetch data from memory keeps growing relative to how fast the CPU runs, then it does not matter how many transistors you add to the processor side because the processor will just spend more and more of its time sitting idle, waiting. That chart above shows fairly clearly that the concern was justified.
Today the gap is somewhere between 50x to 100x in the worst case. The CPU is fast. Getting data to the CPU is not.
But saying "DRAM is slow" is a bit unsatisfying without understanding why it is slow. So before we talk about how hardware tries to work around this problem, it is worth taking a few minutes to look at what is physically happening inside a DRAM chip every time your program asks for a value.
This is the memory wall. The left side is your CPU. The right side is your problem.
How DRAM Actually Works
DRAM stores each bit of data as a charge in a tiny capacitor - a charged
capacitor represents a logic 1, a discharged one represents a logic 0. Billions of these
capacitors are arranged in a grid of rows and columns inside each DRAM bank,
and reading even a single byte from this grid involves more steps than you
might expect.
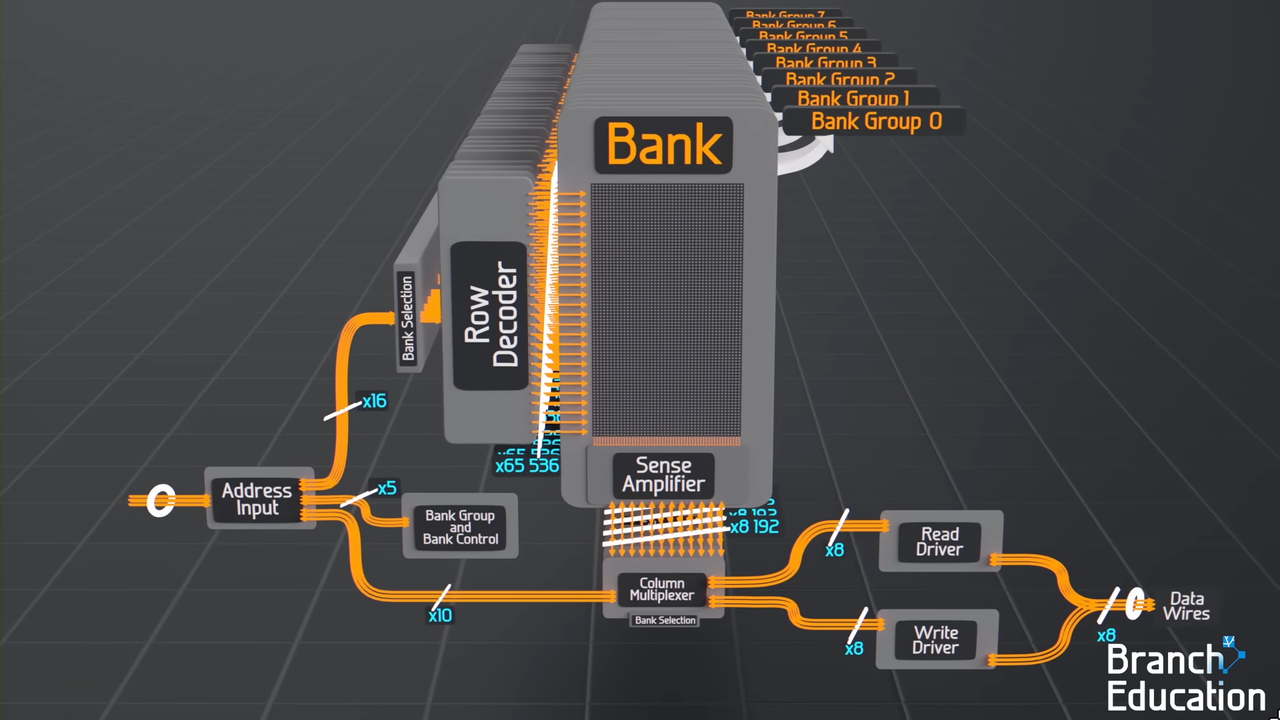
Figure: DRAM bank organization showing row activation into sense amplifiers and subsequent column selection for data access.
Source: Branch Education.
When your CPU requests a memory address, the memory controller first sends a row address to the DRAM. This triggers row activation - the entire row corresponding to that address gets read out onto a set of sense amplifier lines. Think of it like pulling an entire filing cabinet drawer open just to get one piece of paper. Only after the whole row is sitting in the sense amplifiers can the column address come in to select the specific chunk of data you actually asked for.
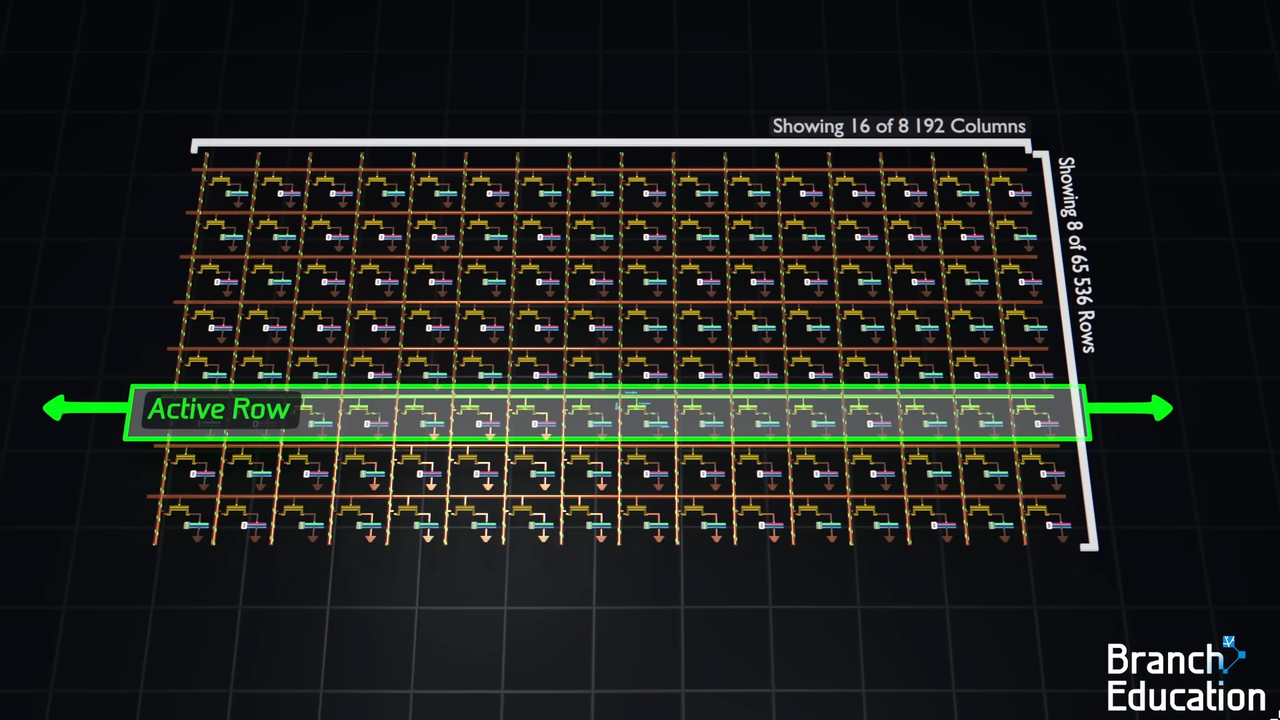
Figure: An entire DRAM row being read into sense amplifiers before a single byte can be accessed.
Source: Branch Education.
The slow part is what happens between two row accesses. Before a new row can be activated, the sense amplifier lines have to be reset back to a neutral voltage - this step is called precharge, and it takes a fixed amount of time that you simply cannot skip. Sequential reads that stay within the same row avoid this cost because the row stays active. But the moment your access pattern jumps to a different row, you pay the full precharge and activation penalty all over again.
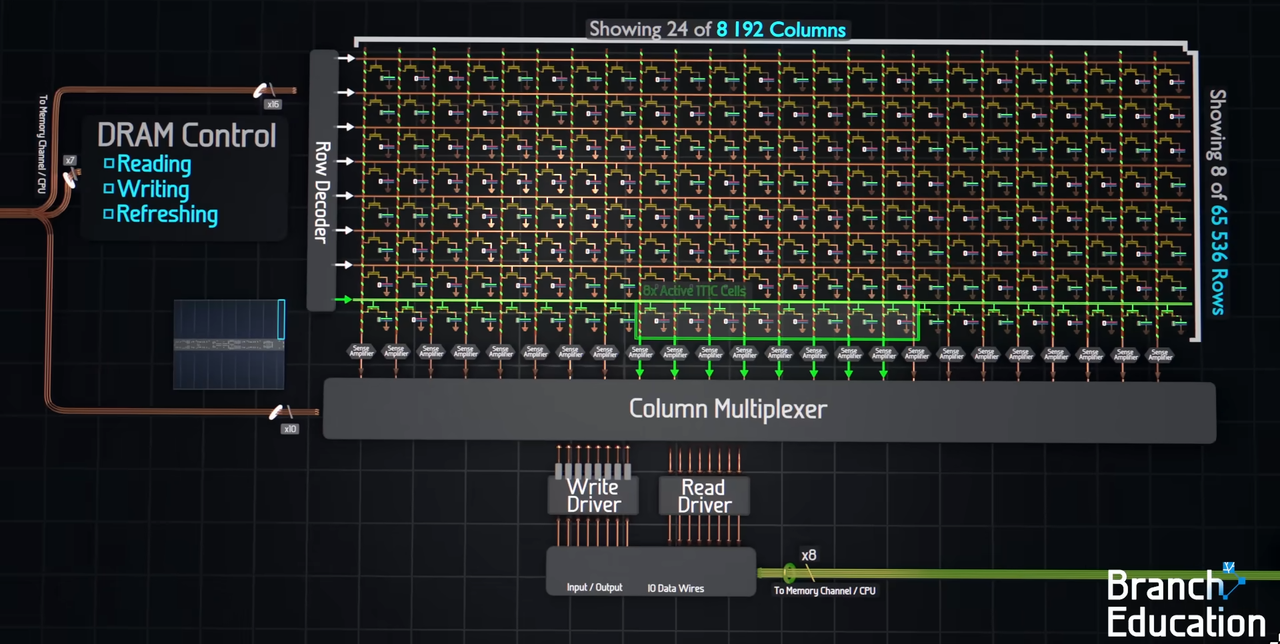
Figure: DRAM read cycle showing precharge, row activation and column selection.
Source: Branch Education.
Random memory access patterns are slow largely because of this - every jump to a new address potentially means a new row activation, which means another precharge cycle, which means your CPU waits. This is not something you can fix in software. It is a physical constraint baked into how DRAM is built, and it is exactly the kind of behavior that showed up in the Aletheia experiments.
The Cache Hierarchy
So if DRAM is this slow, how does anything run at a reasonable speed at all? The answer is that hardware engineers knew about this problem long before it became a crisis, and they built a workaround directly into the processor: a set of smaller, faster memory banks that sit between the CPU and DRAM, called caches.
The idea is simple. Instead of going all the way to DRAM every time the CPU needs data, keep a copy of recently used data closer to the processor where it can be accessed much faster. If the CPU asks for something and it is already in the cache, great - no trip to DRAM needed. If it is not, you go fetch it from DRAM and bring a copy back into the cache for next time.
Most modern processors have three levels of this, called L1, L2, and L3 (L here stands for Level).
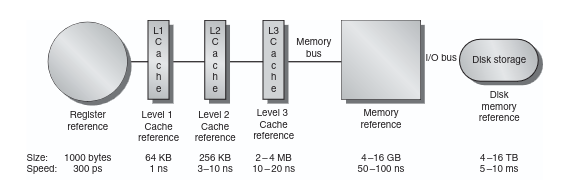
Figure: Memory hierarchy showing cache levels, sizes and access speeds.
Source: Computer Architecture: A Quantitative Approach, Hennessy & Patterson.
L1 is the smallest and fastest - on my Ryzen 9 5900HX it is 32KB per core, and it sits so close to the execution units that it can respond in about 4 clock cycles. L2 is larger at 512KB per core but a bit slower. L3 is shared across all cores, 16MB on this chip, and slower still. And then beyond L3 is main memory - DRAM, which is enormous but comes with all the latency baggage we just talked about.
| Memory Level | Size (5900HX) | Latency |
|---|---|---|
| L1 Cache | 32 KB/core | ~4 cycles |
| L2 Cache | 512 KB/core | ~12 cycles |
| L3 Cache | 16 MB shared | ~40 cycles |
| DRAM | Main memory | ~200+ cycles |
That jump from L3 to DRAM is not a typo. You are looking at a 5x latency penalty the moment your data is not in any cache level and has to be fetched from main memory. This is the cliff we keep talking about - not a gradual slope but a sudden drop the moment you fall out of cache.
The cache hierarchy buys back a lot of the performance that the memory wall takes away, but only if your program is actually using data in a way that lets the cache do its job. And that is where things get interesting - and where Aletheia comes in.
The Experiment
Aletheia started as a simple question: if the memory wall is real and measurable, can I actually see it happen on my own machine with my own experiments rather than just taking a textbook's word for it?
The framework is straightforward. There is a host - a CLI tool that runs experiments and collects results. And there is a node - a server that holds datasets in memory and executes operations on them. Right now both run on the same machine, but the eventual goal is to run the node on my Raspberry Pi 5 to loosely simulate near-memory compute - not the real thing by any stretch, but enough to study how moving compute closer to data actually affects the numbers.
The name Aletheia comes from the Greek word for truth or disclosure - which felt appropriate for a project whose entire purpose is to make the hardware tell you what it is actually doing.
I ran several experiments - a basic dataset scan, a vector addition workload, and the one that ended up being the most interesting: a stride scan.
The stride scan works like this. Instead of reading through an array sequentially, you jump through it at a fixed interval called a stride. A stride of 1 means you read every element. A stride of 4 means you read every fourth element. A stride of 4096 means you are making very large jumps through memory. The access pattern looks like this:
index = (k * stride) % N
The dataset was fixed at 256MB throughout. I tested strides of 1, 4, 16, 64, 256, and 4096, and measured how long each took. My expectation going in was that performance would degrade gradually and smoothly as the stride increased: bigger jumps, slightly worse performance, nothing dramatic.
That is not what happened.
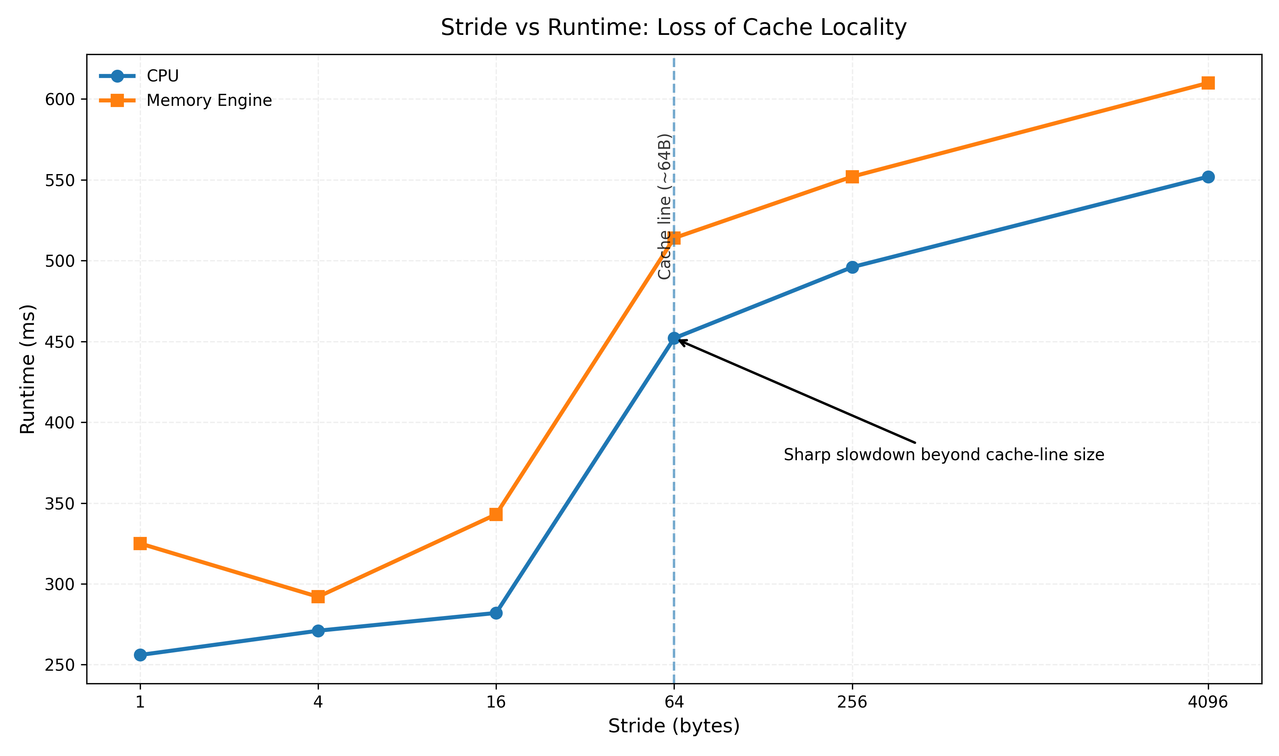
Stride scan on a 256MB dataset - runtime across stride values 1 through 4096, comparing CPU mode and Memory Engine mode. Notice the sharp jump at stride 64.
The 64-Byte Moment
Look at that graph. From stride 1 to stride 16, performance degrades slowly and predictably - a few percent each step, nothing alarming. Then stride 64 hits and runtime jumps from 282ms to 452ms, a 60% increase in a single step. Everything after that is relatively flat again. Not a gradual slope but more like a cliff.
That cliff is not a bug, not a fluke, and not specific to my machine. It is the cache line making itself visible.
Here is what a cache line is. When your CPU asks for a value from memory,
the hardware does not fetch just that one value - it fetches an entire
64-byte chunk of memory surrounding that address and loads the whole thing
into cache. The reasoning is simple: if you just accessed address X, there
is a very good chance you will soon need X+1, X+2, X+3. This is called
spatial locality, and for sequential access patterns it works beautifully.
You pay the cost of one memory fetch and get 64 bytes of useful data in return.
Now think about what happens with a stride scan. At stride 1, every element you access is already sitting in cache from the previous fetch - you are riding the cache line perfectly. At stride 4, you are still getting some benefit, touching a few elements per cache line. At stride 16, you are getting less efficient but still pulling multiple useful values per fetch.
At stride 64, everything changes. Each access now lands on a completely different cache line. Every single read is a cache miss. The hardware fetches 64 bytes, you use 8 of them, throw the rest away, and immediately pay the full cost again for the next element. The cache is now effectively useless.
| Stride | Elements used per cache line fetch | Cache misses per N elements |
|---|---|---|
| 1 | 8 of 8 | N/8 |
| 4 | 2 of 8 | N/8 |
| 16 | 1 of 8 (partial) | ~N/4 |
| 64 | 1 of 8 | N (every access is a miss) |
| 4096 | 1 of 8 | N (every access is a miss) |
Beyond stride 64 the situation does not get dramatically worse because you are already paying the maximum possible penalty - one full cache miss per element. Going to stride 256 or 4096 does not change that, which is exactly why the curve flattens out after the cliff.
What the Numbers Are Really Saying
The stride scan result is interesting on its own, but it becomes more interesting when you ask a slightly different question: not just "why is this slow" but "what is actually the limiting factor here, and how close are we to its theoretical limit?"
There is a useful mental model for this called the Roofline Model. The idea is straightforward - every program is either limited by how fast your CPU can compute, or by how fast memory can supply data. These are two different ceilings, and which one you hit depends on how much computation your program does per byte of memory it reads. This ratio has a name: operational intensity, measured in operations per byte.
A program that reads a huge array and does almost nothing with each element -
like a vector_add (just vector addition) - has very low operational intensity. It is spending
most of its time waiting for memory and almost no time actually computing.
This is called being memory-bound, and it is exactly what the dataset scan
in Aletheia is. On a 256MB dataset, the scan finishes in about 92ms in CPU
mode. The CPU is not struggling to do the arithmetic - it is struggling to
get the data fast enough to have something to do arithmetic on.
A program that reads less data but does a lot of work on each value - matrix multiplication is the classic example - has high operational intensity. It can keep the CPU fed without hammering memory constantly. This is called being compute-bound, and it is a much more comfortable place to be.
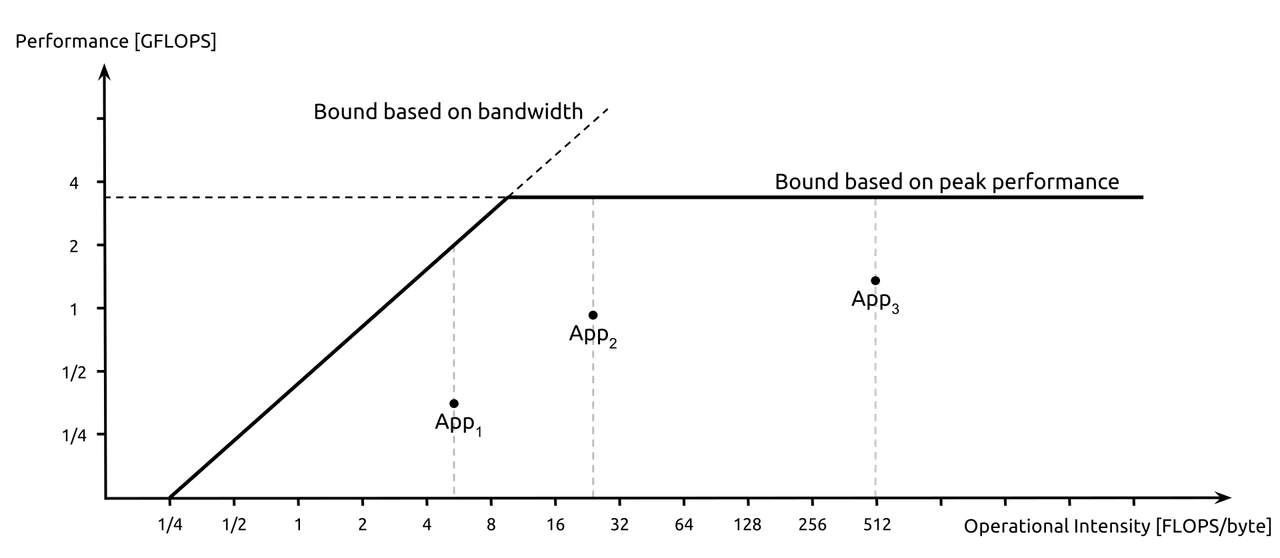
Figure: The Roofline Model - performance is bounded either by memory bandwidth (left slope) or peak compute (flat line). Most programs sit further left than their authors expect.
Source: Wikipedia
The reason this matters for the memory wall conversation is that most programs people assume are compute-bound are actually memory-bound. They look at CPU utilization, see it maxed out at 100%, and assume the processor is the bottleneck. But a CPU can show 100% utilization while spending the majority of its cycles stalled on memory - it is busy waiting, not busy working. The roofline model forces you to be honest about which ceiling you are actually hitting.
In Aletheia's case, the stride scan at stride 64 and beyond is about as purely memory-bound as a workload can get - one useful value fetched per 64-byte cache line, maximum cache miss rate, the CPU reduced to waiting on every single access. There is no amount of CPU optimization that fixes that. The only fix is changing how you access memory.
So What?
This is the part where I am supposed to give you a neat list of performance tips. Use sequential access patterns. Keep your working set in cache. Avoid pointer chasing. And those things are all true, but they feel a bit hollow without the intuition behind them, which is what this whole blog has been trying to build.
The real takeaway is simpler than any tip list: before you optimize anything, figure out what you are actually waiting on. If your program is memory-bound, making the CPU faster does nothing - you need to change how you move data. If it is compute-bound, then cache locality is not your problem and you can focus elsewhere. Getting this wrong means spending time optimizing the wrong thing entirely, which is a very efficient way to make no progress.
The stride scan experiment made this concrete for me in a way that reading about it never quite did. As Shakira once said, hips don't lie. Neither do memory benchmarks - at stride 1 you are working with the hardware, at stride 64 you are working against it, and the difference is 60% of your runtime showing up as a penalty you did not see coming.
Memory access patterns are a first class concern in performance-sensitive code, not an afterthought. The hardware is fast. Getting data to the hardware is the hard part. And now at least you and I know exactly where the wall is.
Closing
We started with a simple and mildly embarrassing observation: a program that should be fast, running on hardware that is objectively fast, taking 400 milliseconds to do something that felt like it should take much less.
Understanding the memory wall does not make you a better programmer overnight, but it does change what questions you ask when something feels slow. Instead of immediately reaching for algorithmic improvements or compiler flags, you start asking where your data lives, how your code moves through it, and whether the cache is helping or completely out of the picture.
That shift in thinking - from "how do I compute faster" to "how do I move data better" - is probably the most useful thing systems programming has taught me so far. And it took a 60% performance cliff appearing out of nowhere at exactly 64 bytes to really make it stick.
The wall was always there. You just never had a reason to look for it.